For the online graphing tools assignment, we were asked to use several resources to create 2 graphs, one comparing 4th grade reading scores of WV to the national average, and another comparing 8th grade math scores of WV to the national average. The resources I used to create these 2 graphs were:
Kid's Zone and
National Assessment of Educational Progress. Below are the graphs I created using these resources! Click on the pictures below to view a larger image of each of my graphs...
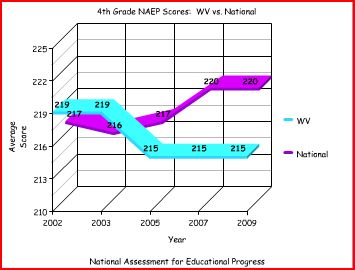
The 4th grade NAEP reading scores were actually higher in 2002 for WV than the national average. In 2003, WV continued to rise above the national average, but not by much. In 2005, 2007, and 2009, WV showed a decrease in 4th grade reading scores, compared to the national average.
The 8th grade NAEP math scores were below the national average in the years 2000, 2003, 2005, 2007, and 2009. In 2000, the scores were very close to be equal, WV at 223 and the national average at 224. The years 2003, 2005, and 2007 were also close scores, but in 2009 the scores showed more of a decrease in math scores.
The "Online Graphing Tools" assignment closely relates to the ISTE.NETS STANDARD 5c: This assignment asked us to evaluate and reflect on current research and use professional practice to make effective use of existing and emerging digital tools and resources to support student learning.


No comments:
Post a Comment